Registrations
A breakdown by quarter and jurisdiction is displayed in Table 1.
Table 1: Registration summary
| Jurisdiction |
Q1 23–24 |
Q2 23–24 |
Q3 23–24 |
Q4 23–24 |
Q1 24–25 |
Q2 24–25 |
Total |
|---|---|---|---|---|---|---|---|
| Australian Capital Territory |
135 |
109 |
103 |
58 |
91 |
56 |
552 |
| New South Wales |
2,271 |
2,476 |
1,710 |
1,598 |
1,482 |
1,618 |
11,155 |
| Northern Territory |
55 |
62 |
38 |
33 |
41 |
52 |
281 |
| Queensland |
1,474 |
1,536 |
1,143 |
1,083 |
904 |
1,061 |
7,201 |
| South Australia |
480 |
477 |
302 |
353 |
259 |
332 |
2,203 |
| Tasmania |
187 |
196 |
149 |
102 |
114 |
130 |
878 |
| Victoria |
2,007 |
2,254 |
1,438 |
1,321 |
1,173 |
1,389 |
9,582 |
| Western Australia |
887 |
834 |
562 |
539 |
457 |
540 |
3,819 |
| Total |
7,496 |
7,944 |
5,445 |
5,087 |
4,521 |
5,178 |
35,671 |
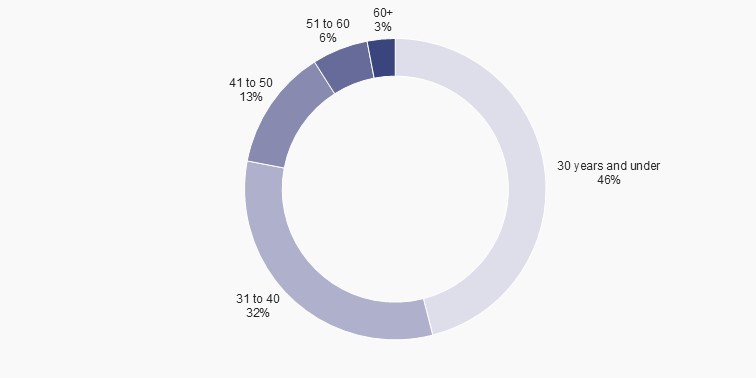
Age of registrants
Figure 1 provides a breakdown of registrants by age group.

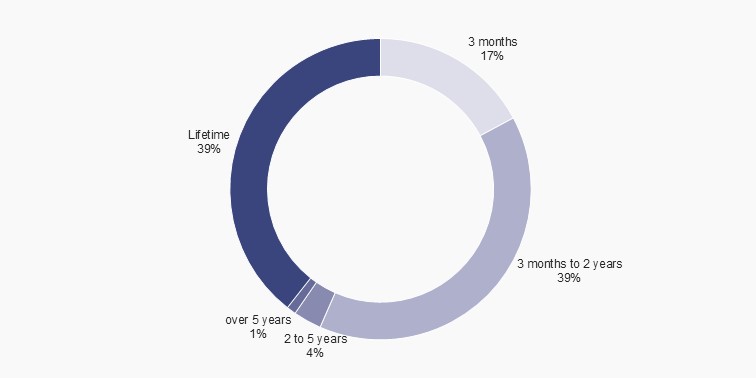
Exclusion periods
Figure 2 provides a breakdown of the length of exclusion that registrants have chosen.

