Registrations
A breakdown by month and jurisdiction is displayed in Table 1.
Table 1: Registration summary
| Jurisdiction | August 2023 | September 2023 | October 2023 | November 2023 | December 2023 | January 2024 | Total |
|---|---|---|---|---|---|---|---|
| Australian Capital Territory |
79 |
56 |
46 |
42 |
21 |
37 |
281 |
| New South Wales |
1,155 |
1,117 |
951 |
901 |
625 |
605 |
5353 |
| Northern Territory |
26 |
28 |
20 |
29 |
13 |
11 |
128 |
| Queensland |
778 |
698 |
602 |
581 |
353 |
413 |
3,424 |
| South Australia |
256 |
224 |
200 |
178 |
99 |
116 |
1,073 |
| Tasmania |
106 |
81 |
89 |
69 |
38 |
55 |
438 |
| Victoria |
1,024 |
982 |
869 |
881 |
503 |
527 |
4,787 |
| Western Australia |
454 |
432 |
344 |
310 |
180 |
219 |
1,939 |
| Total |
3,878 |
3,618 |
3,121 |
2,991 |
1,832 |
1,983 |
17,423 |
Age of registrants
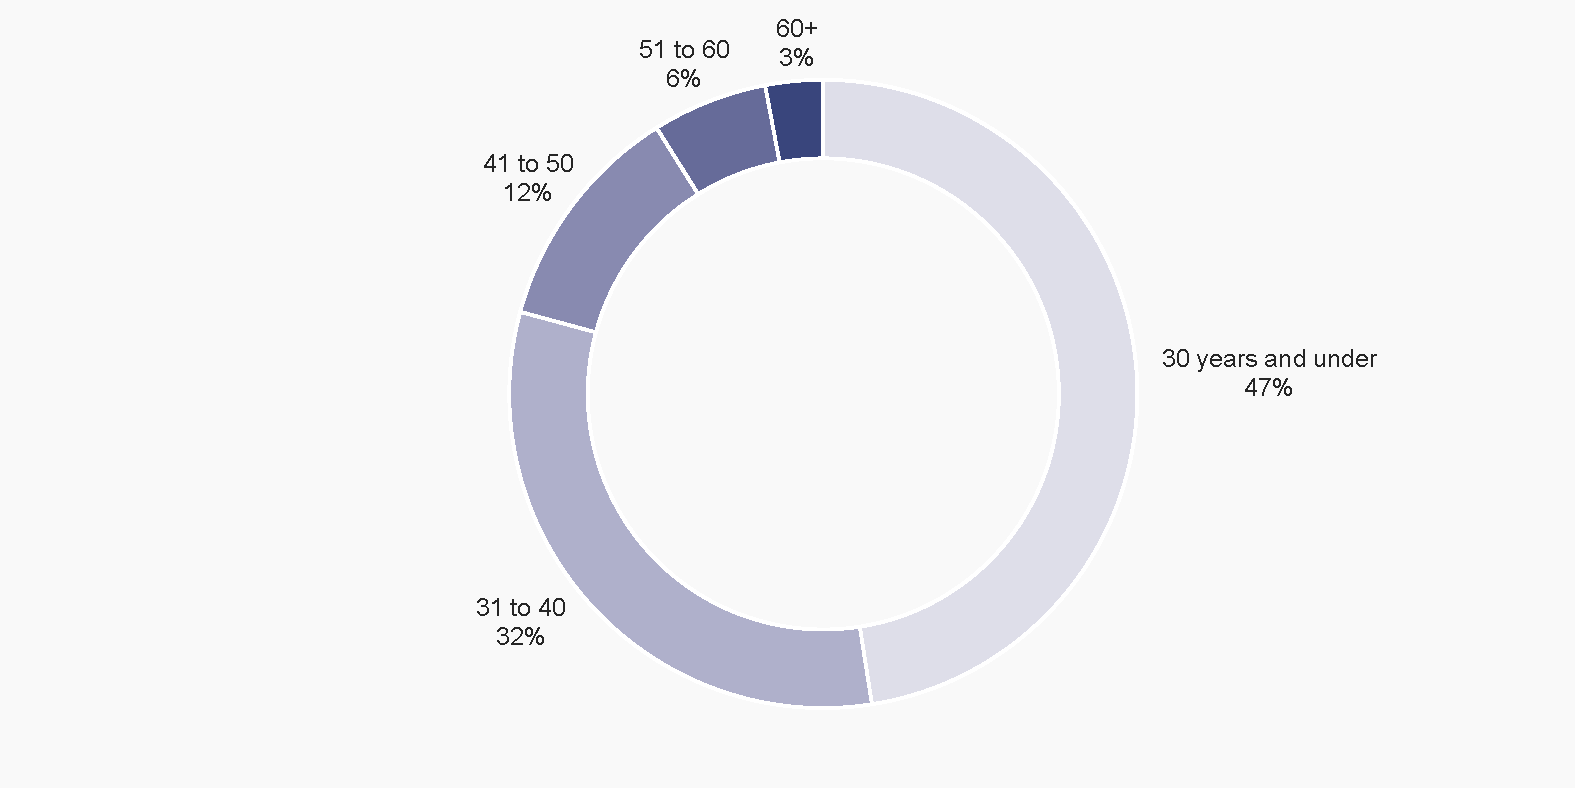
Figure 1 provides a breakdown of registrants by age group.

Exclusion periods
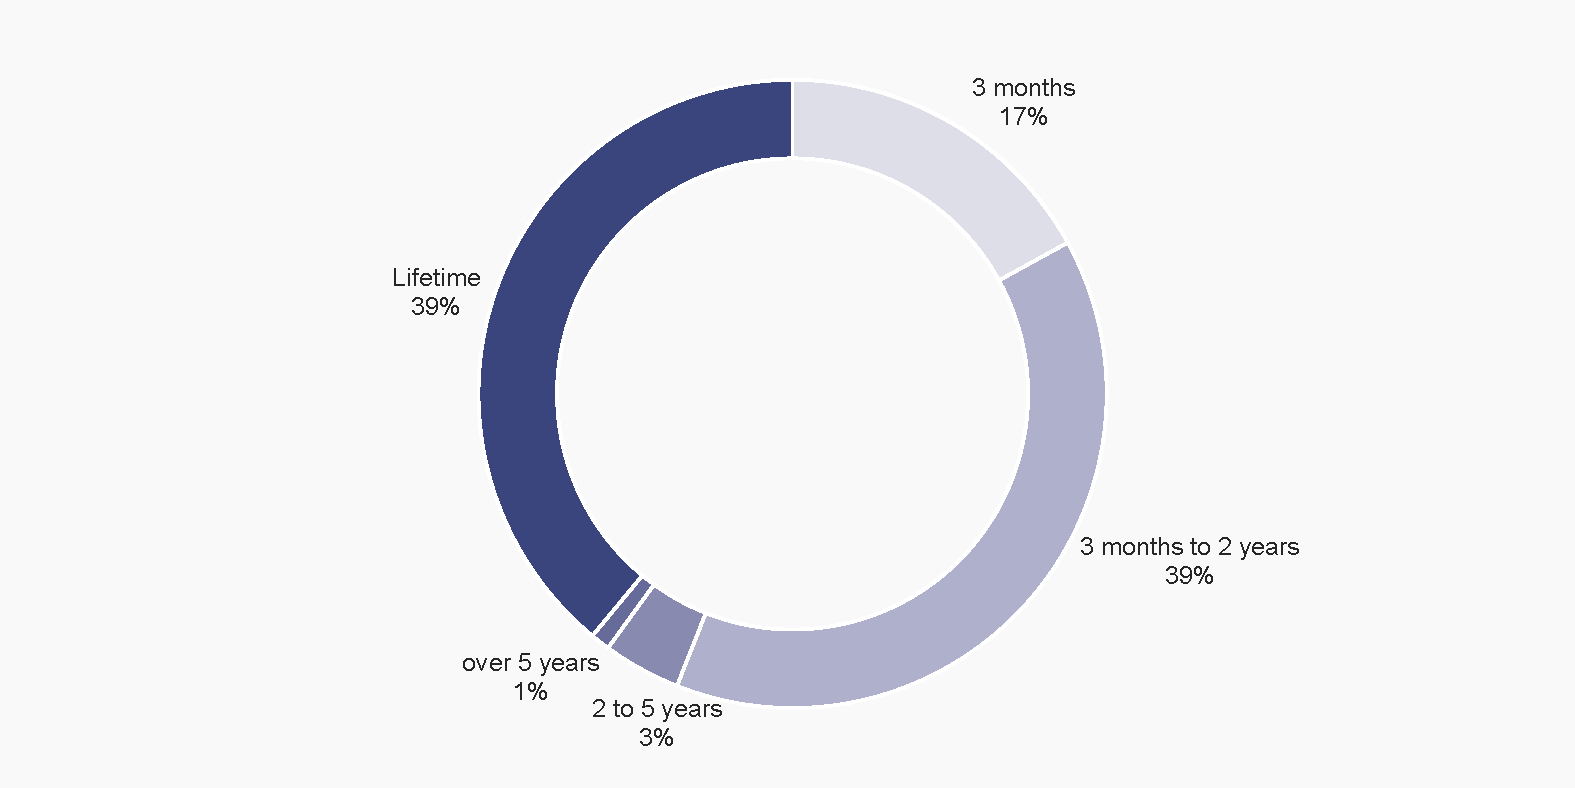
Figure 2 provides a breakdown of the length of exclusion that registrants have chosen.

