On this page
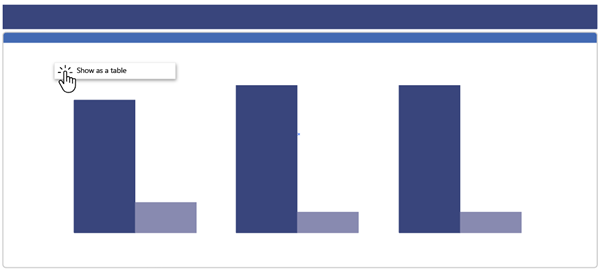
Show the data as a table within the report

- Right click on the chart
- Select ‘Show as a table’
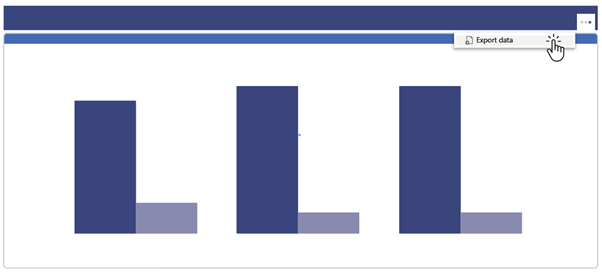
Export the data

- Click ‘More options’ from the ellipsis icon in the top right of the chart area and select ‘Export data’
- Choose to export the summarised data in Excel or .csv format
- Select ‘Export’ and the data file will download.
